
As a Site Reliability Engineer for the SWAT team at BitTitan, my daily life consists of working on escalations coming from the Product Group or Support Team. I’m responsible for making sure migrations run efficiently and smoothly for millions of users and billions of items. Before joining BitTitan, I spent 14 years working for Microsoft as an Escalation Engineer and Premier Field Engineer.
I love my job—so I’m happy that I was asked to share a few of my tips for software troubleshooting and debugging. As I was pulling these together, I quickly realized that this is more than just one blog—I’ve split them out into three posts. For today, I’ll talk about three tools for debugging.
On a daily basis I battle memory leaks, GC contentions, .NET crashes, performance issues. The titles associated with the escalations I see have beautiful designations, like:
- “The migration is stuck at 6%”
- “The service is not responding to pings”
- “The IIS Servers are reporting HTTP 500”
- “The migration is slow”
- “The workers are consuming 90% CPU”
My team works on investigating these issues, finding the root cause and working with the product group on how to avoid them in the future. If the fix is quick to implement, we do that ourselves. We do have access to the source code and use it for most of the investigations.
Most of our time is dedicated on reactive issues. When we have free time, we do proactive work like creating tools/scripts or Kibana queries, which I’ll talk more below. Likewise, we often depend on tools to do our work. Some of these tools are free, powerful and not very well known—I’ll share more on these in a moment.
Also keep in mind that troubleshooting and debugging are part art, part science. Some people use the same tools in different ways; others use different tools altogether for the same task. What is important is to follow a scientific approach instead of taking random actions with no clear purpose, and to be methodical when investigating software problems.
Here are three tools I value highly in troubleshooting and debugging:
These are the pair of tools we use to analyze our logs. ElatiscSearch centralizes logs from different servers in one place, with powerful query capabilities. Kibana enables us to visualize the information from the logs, using nice charts and queries.
We use these tools to analyze IIS logs, our applications logs, and event logs from several servers at the same time. We can find patterns – for example, seeing if specific first-chance exceptions are related, or finding pages causing HTTP 404. We can easily find out the time of the day when our applications are logging more of a specific exception. These save us a lot of time: consider the manual work of having to collect IIS logs and Event Logs from, say, 8 remote computers and manually analyzing them.
Tip: Using Python (and Visual Studio in our case) it’s possible to create alerts. These alerts run queries that extract specific information from the logs and notify the appropriate person when something appears abnormal.
Performance Analysis of Logs (PAL)
Performance Analysis of Logs is a tool used to analyze Performance Monitor logs. Performance Monitor, or PerfMon, is part of the Operating System and helpful in finding trends and bottlenecks.
For example, suppose your application is a mixed application, so it uses native code (C/C++) and managed code (.NET). Perhaps you suspect that your application is consuming too much memory over time without releasing that memory. Using PerfMon, you can collect a log for 5 hours, for example, then manually analyze it and prove if the application is increasing the memory consumption over time, and whether this memory consumption is related to the managed or native code.
You won’t get the root cause via PerfMon, but you can collect valuable information about the symptom to focus and continue your investigation using the right set of tools.
In the example above, if you have collected a PerfMon log, PAL can automatically analyze the log and create a nice report clearly showing problems or potential problems.
The biggest problem engineers have when analyzing PerfMon logs is knowing the threshold to use for each counter. PAL has this knowledge, so if you collect a PerfMon log from your ASP.NET application, for example, you can select the ASP.NET filter, and it will analyze the log following the thresholds for the product. Same for SharePoint, SQL Server, Exchange, etc.
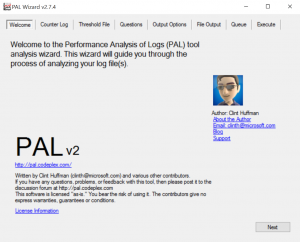
Tip: When using PAL to analyze Performance Monitor logs that you’ve created, select the Objects and Counters you want and on the Threshold File tab select Auto-detect. That way PAL can detect which threshold files it should use to perform the analysis based on the Objects/Counters you’ve collected.
Tip 2: If you’re not familiar with PerfMon and need to collect a PerfMon log, do this: run PAL, go to the Threshold File tab, as seen above, and select the Threshold file title according to the product you want to monitor. Then click Export to Perfmon template file… so you can load this template from Performance Monitor and use it. This template has all the Objects and Counters you need to collect information from your server. If you don’t know what to use, just use System Overview. You can learn more about PAL reading the author’s blog.
Often when you encounter a problem related to an application, the best thing to do is to debug the application. However, many problems don’t happen in the development or test environment but rather on the production servers. This is a tricky situation because you can’t just install Visual Studio there and debug it. This approach is too invasive.
In situations where applications running on production servers need to be debugged, we need to tread carefully. Our approach, then, is to collect dump files from the application and copy them in a place where we can debug them.
Full user mode dump files are large binary files that contain the content of a specific application at a certain moment in time. The process of debugging dump files is called “post-mortem analysis,” and it is very time consuming and technically complex.
Enter DebugDiag! DebugDiag is a tool for troubleshooting issues, which has a nice user interface and can be used to collect dump files based on specific rules. Moreover, DebugDiag can be used to analyze those dump files!
Many tools can collect dump files—my favorites are ProcDump and Process Explorer; however, there are advantages of DebugDiag:
- It is run as a service, so if the computer is rebooted it doesn’t affect the DebugDiag settings
- It uses rules to collect dump files, and these rules can be customized
- It can be used to analyze dump files, saving a lot of time used to manually debug the dump files. Many times the automated analysis is enough to pinpoint the root cause
Here are some examples of situations where you can use DebugDiag to collect dump files:
- When one or more URLs from a web application take more than “n” seconds to respond (slow HTTP response times)
- When % Processor Time for a specific application is over 85% for 30 seconds (ProcDump can also be used for this scenario)
- When the application is crashing
- When the application is throwing a specific first-chance exception
- When an application built in C/C++ is leaking memory
- When an application breakpoint is hit
Real example: Some time ago, I had to investigate why the migration was “stuck” according to some of our customers. After setting up DebugDiag to collect dump files for slow requests (Performance rule), I got some dump files when the rule was triggered, and analyzed them using DebugDiag Analysis. The HttpContext report from DebugDiag showed Http requests were set to 90000 seconds, which is 25 hours! With that information I opened our .config file and found the culprit:
<httpRuntime targetFramework=”4.5″ maxRequestLength=”1048576″ executionTimeout=”90000″/>
After reducing the timeout to a much more reasonable 300 seconds the symptom didn’t happen again, because any long-duration SOAP request would timeout instead of being stuck for hours.
Tip: When you create a Crash Rule, DebugDiag logs all first-chance exceptions in a text file while monitoring the application to collect dump files if the exception specified in the Crash Rule is triggered.
Once you’ve collected dump files with DebugDiag (or any other tool for that matter) you can use DebugDiag to debug the dump files.
These are the rules I use for .NET code when SharePoint is not involved:
Tip: Other tools like Visual Studio, WinDbg, ProcDump, Process Explorer, etc. can be used to collect dump files. You can use DebugDiag to debug them.
Tip 2: Set DebugDiag to use the symbols from your application as well as the Microsoft symbols (PDB files) so the analysis will give you more granular information like line numbers, name of the source code file and parameters.
You can learn more about DebugDiag and its latest updates from the tool blog. There are tons of material related to DebugDiag on the internet, even from the Microsoft support site.
That’s it for now! Keep an eye out on our blog for part 2 released on February 2nd and part 3 released on February 9th of this Tips and Tools series.